

A polished, local-first macOS interface for understanding Apple system_profiler reports.
Overview
Link to section: OverviewSystem Profiler Explorer is a native SwiftUI application that runs Apple’s read-only /usr/sbin/system_profiler utility and turns its structured JSON into organized, searchable findings. Values remain traceable to their original data type and source field while collapsible explanation cards describe:
- what the finding means;
- why the value may matter;
- how to interpret it without overstating the evidence; and
- whether it may expose private or identifying information.
The app can scan this Mac directly or import an existing raw JSON report. Processing stays on the Mac: there is no account, analytics SDK, cloud service, or network upload.
Current source features
Link to section: Current source featuresThe features below are included in v0.1.2 and the current source on main, including collection health, the comparison dashboard, snapshots, review summaries, and diagnostic-log explanations.
- All supported
system_profilerdata types represented by the app’s current macOS toolchain - A sidebar with eight subjects (Overview, Hardware, Storage, Network, Software, Security, Power, and Reports) and the What Changed? tool
- Complete Reports scan plus focused, faster subject scans
- Collapsible records and explanations with source provenance
- Search across names, values, fields, and explanations
- Precomputed report indexing and debounced, cancellable search for large inventories
- Plain-language explanations of each reported value, not only its field, with a status (Normal, Info, Worth a look, Not yet explained) and a confidence level; heuristic readings are labeled “Likely” with their reasons
- At a glance summary at the top of each report, listing any values worth a look
- Beginner and Developer modes; Developer adds raw values, source paths, counts, and explanation sources
- Worth a look, explained-only, and privacy-sensitive filters
- Glossary of terms used in explanations, and copy actions for values, source paths, and findings as Markdown
- Recent-search history, source-location links, and persistent bookmarks
- What Changed? workspace that compares a report with a saved snapshot or report file, with added/removed/changed cards, evidence-ranked review groups, and plain-language difference explanations
- Local named snapshot history with timestamps, full/redacted storage choices, and retention controls
- Share menu: a Markdown or PDF summary, or the full report file (redacted or complete)
- Visible explanation-coverage labels: curated explanation, general data-type context, or unrecognized field
- Compact diagnostic-log rows, background AVE/HEVC pattern summaries, and paged original text with explicit interpretation limits
- Local JSON import, redacted or full export, and saved-report comparison
- Responsive 100-record paging for large software and full-system sections
- Universal application bundle for Apple silicon and Intel Macs
Screenshots
Link to section: ScreenshotsOverview at a glance
Link to section: Overview at a glance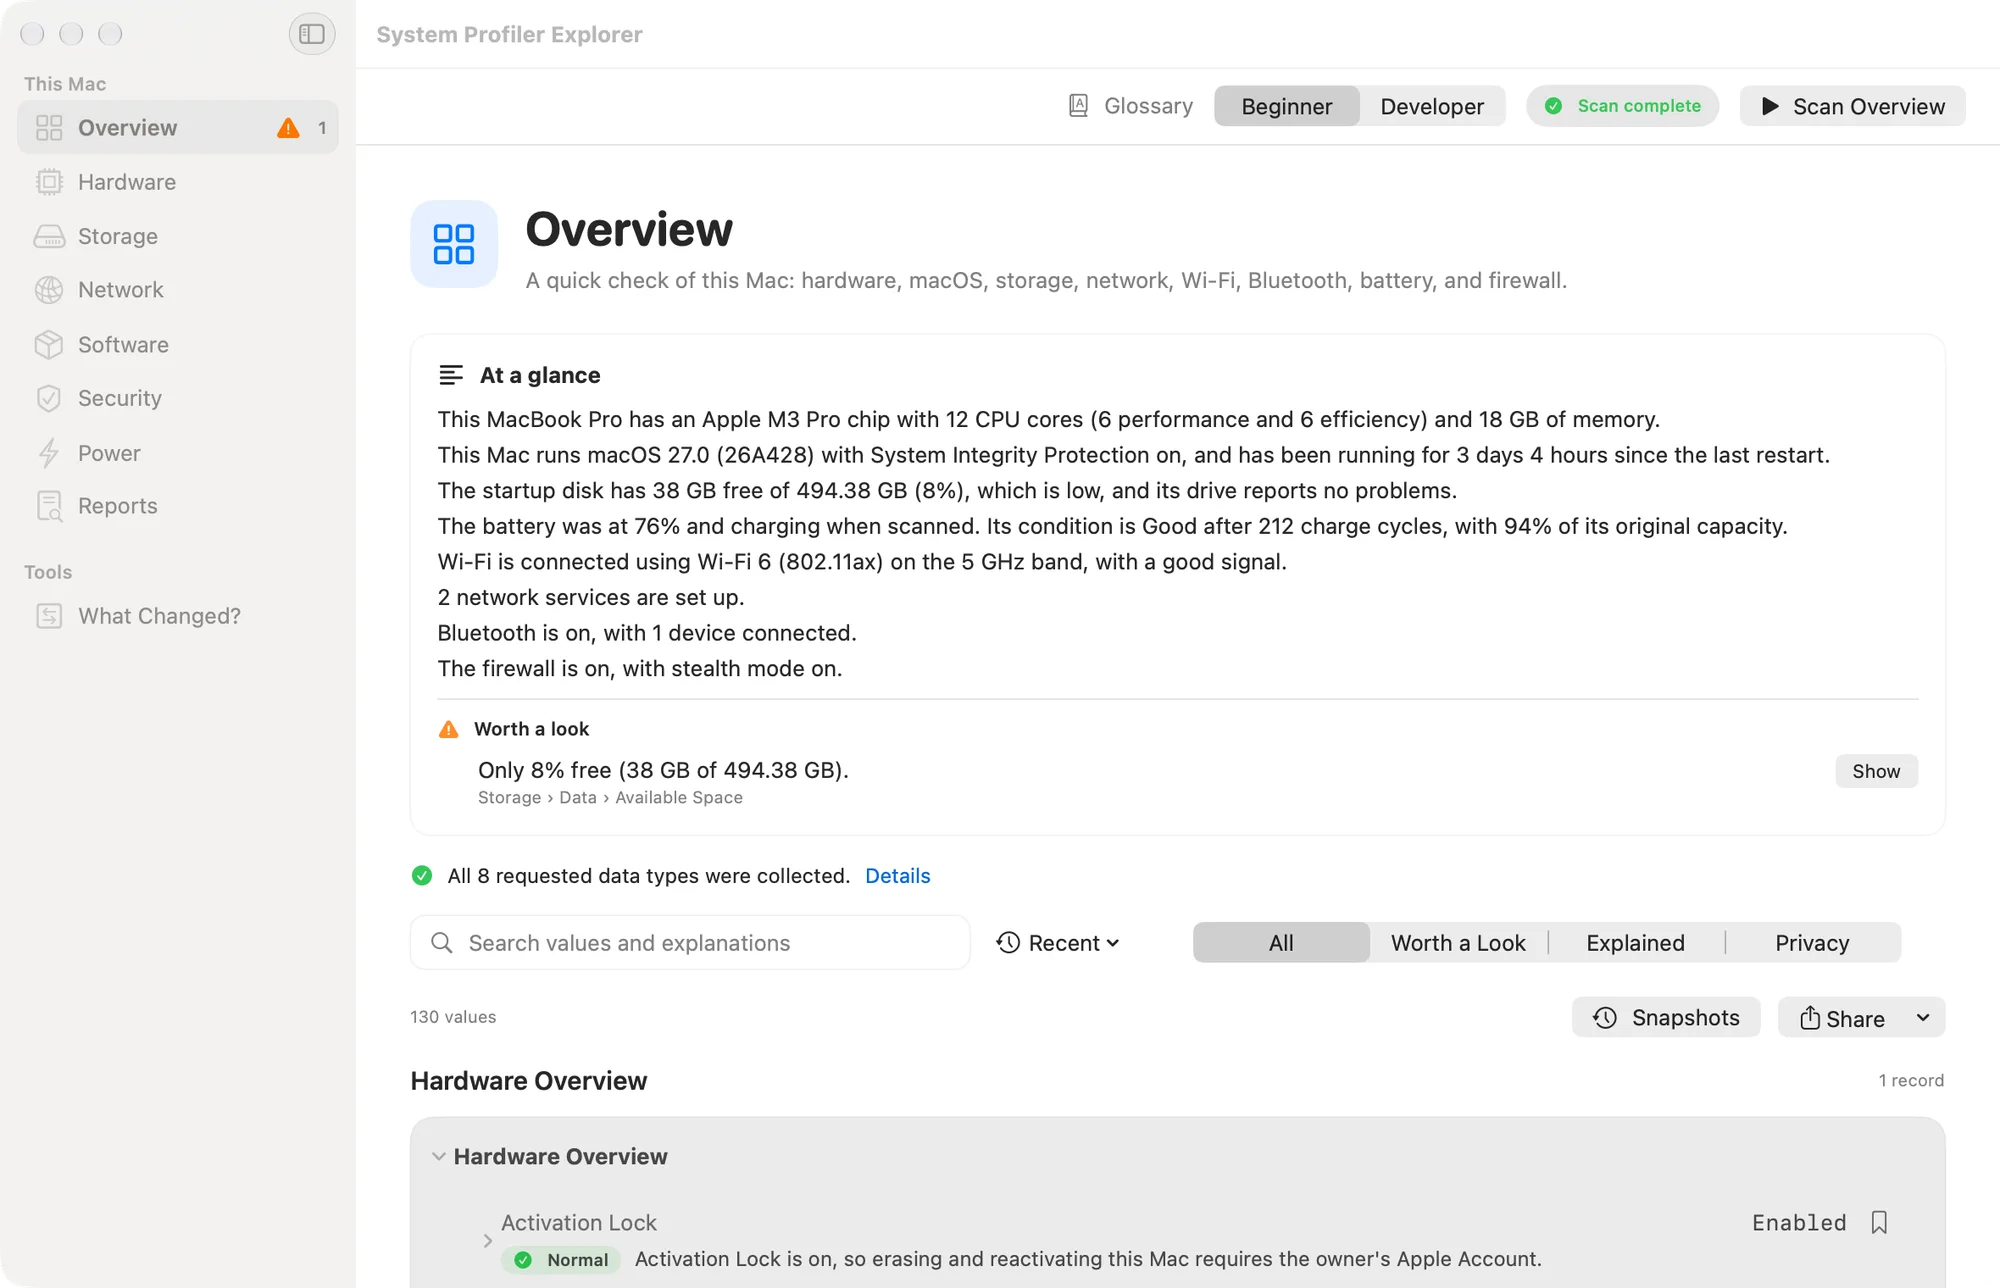
Overview turns a quick scan into plain sentences about the chip, macOS, storage, battery, Wi-Fi, Bluetooth, and firewall, and lists any values worth a look. The sidebar shows how many values in each subject need attention.
Searchable full report
Link to section: Searchable full report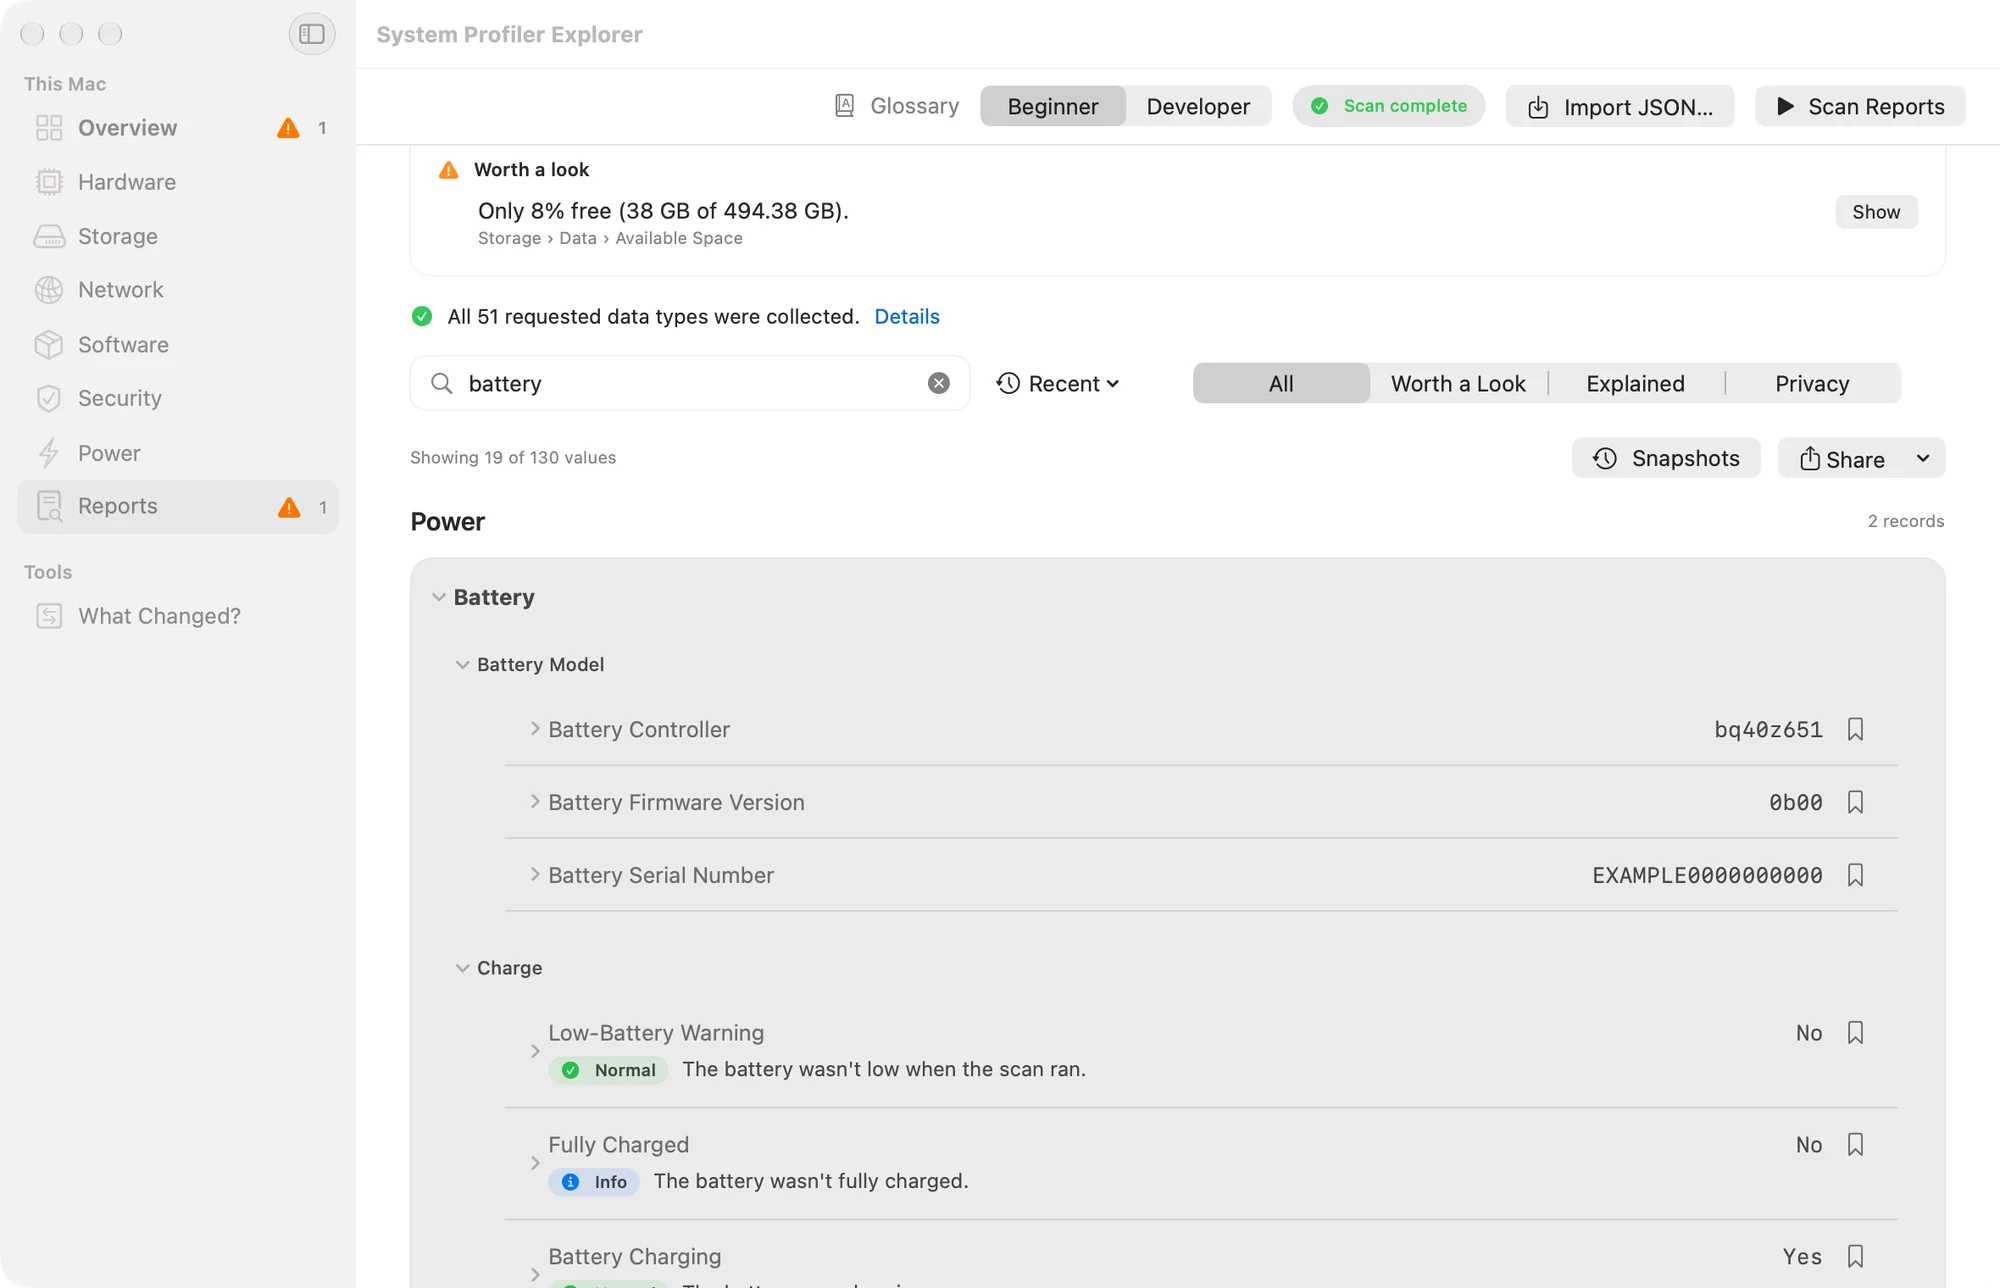
Reports collects every supported data type. Search matches values and explanations, and each value shows a status (Normal, Info, or Worth a look) with a short explanation.
Value explanations
Link to section: Value explanations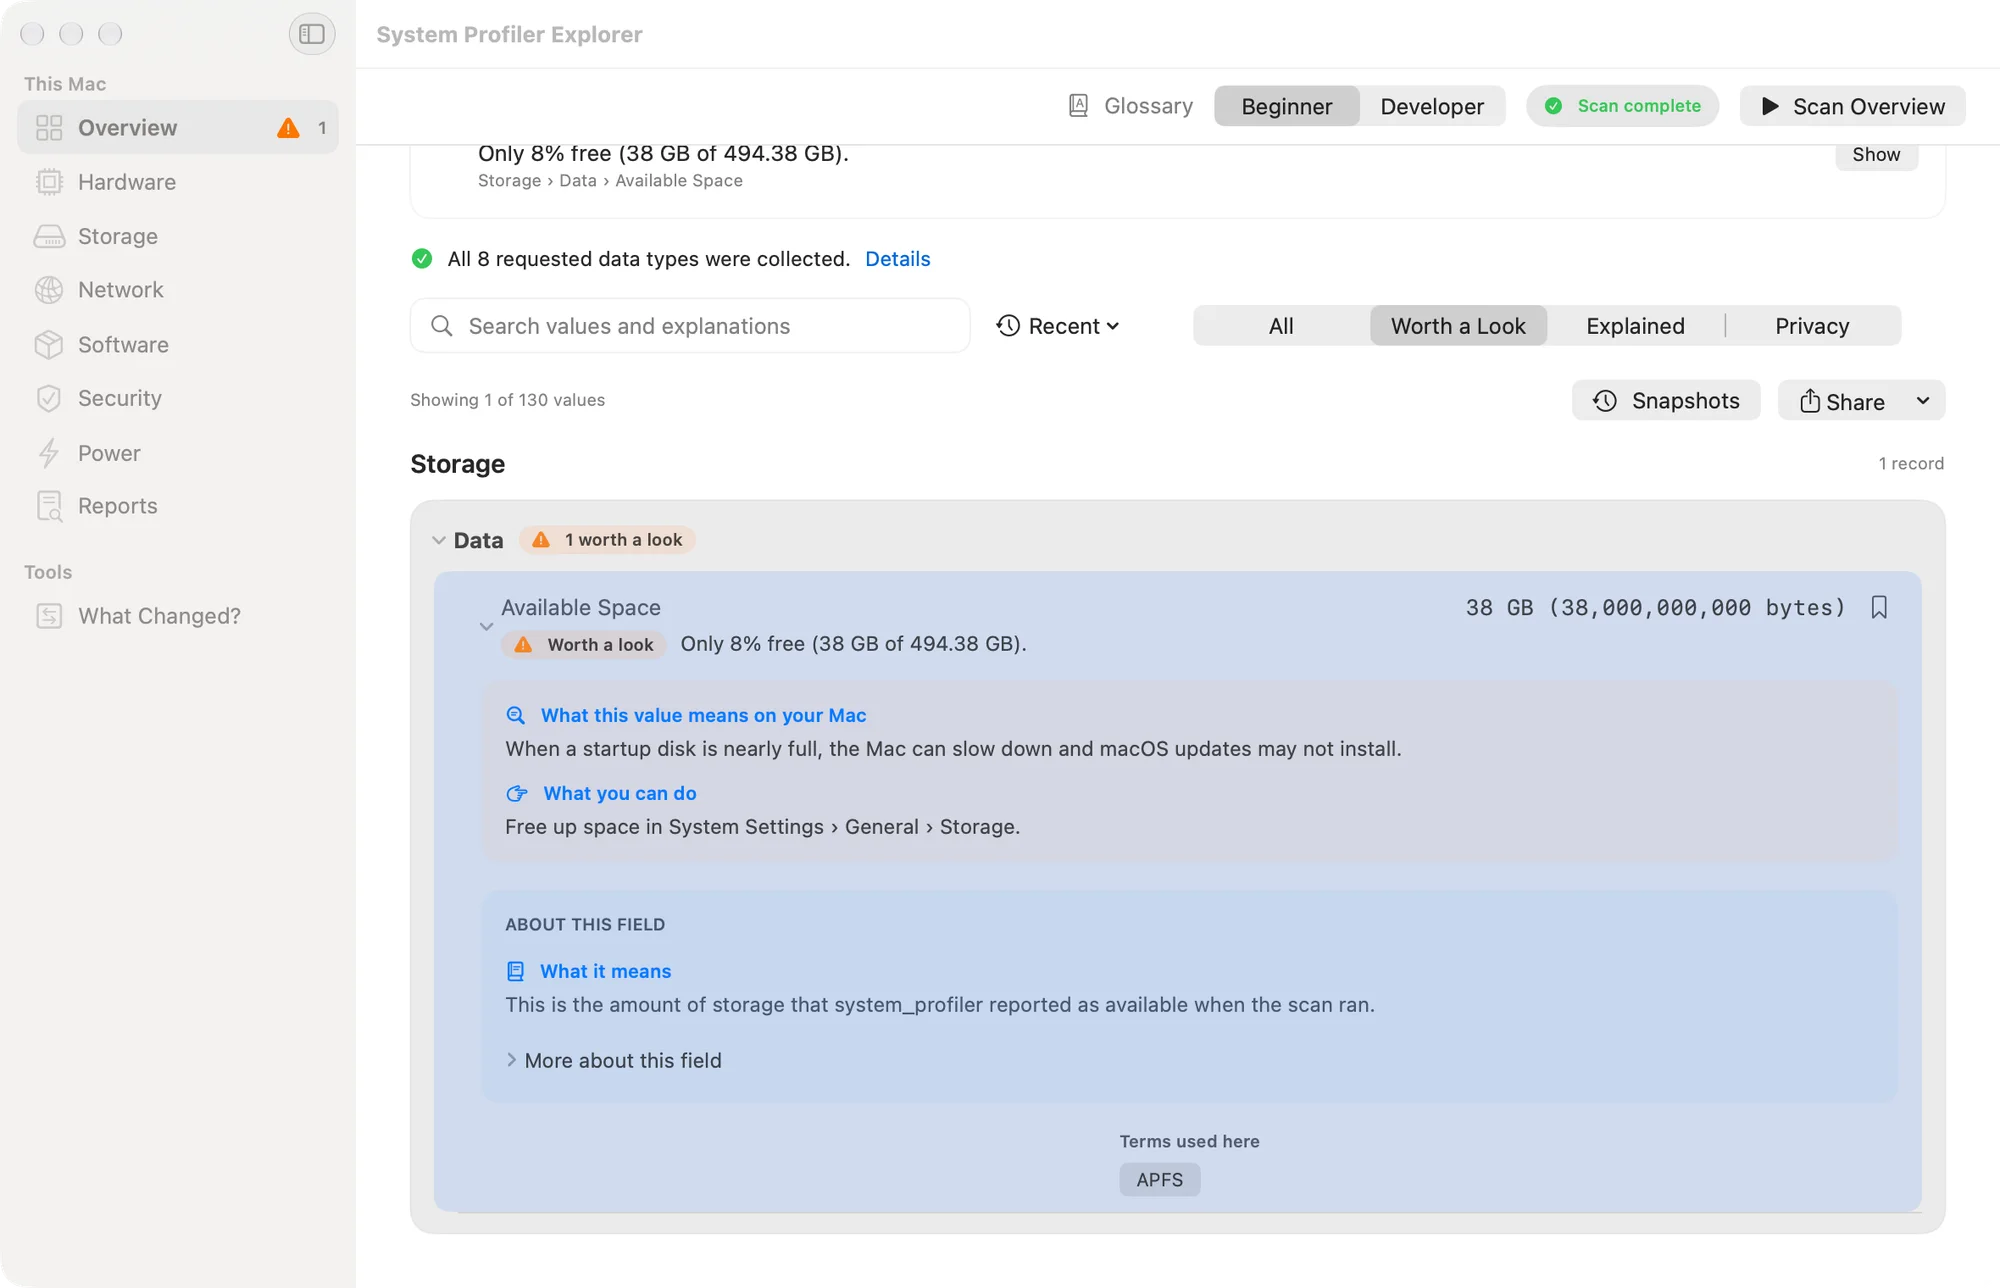
Expanding a value explains what it means on this Mac, what you can do about it, and what the field itself reports, and which glossary terms it uses.
These screenshots were captured from the current app using a synthetic sample report. They contain no real system inventory or personal identifiers.
Coverage
Link to section: CoverageThe focused subjects organize commonly reviewed findings. Reports is the exhaustive view: it requests every supported data type, preserves sections even when the Mac returns no records, and displays collection coverage rather than silently treating missing data as absence. The What Changed? workspace analyzes already collected reports; it never launches a hidden scan or merges data from different collection times.
For every live scan, each requested data type is marked as Collected, No records, Skipped, Unavailable, Timed out, or Permission-limited. No records means system_profiler returned an empty section. Unavailable, Timed out, and Permission-limited are shown only when matching diagnostic text supports that scan-level label; otherwise the app records a missing JSON section as Skipped instead of guessing a cause. Use View Incomplete Collection in the Collection coverage card to inspect every incomplete data type and the diagnostic output from system_profiler. Imported JSON does not preserve its original command scope, so it reports only the data types present in that source file.
| Subject | Purpose |
|---|---|
| Overview | Launch a full scan, import a report, and review app capabilities and privacy boundaries. |
| Hardware | Hardware overview, memory, displays, buses, cameras, audio, controllers, and attached devices. |
| Storage | Storage volumes and interfaces including NVMe, SATA, SAS, Fibre Channel, and network volumes. |
| Network | Interfaces, Wi-Fi, Ethernet, Bluetooth, locations, addresses, and active configurations. |
| Software | macOS/software overview, applications, frameworks, extensions, fonts, install history, tools, profiles, and related inventories. |
| Security | Security-related profiler sections and fields, including firewall, secure element, smart cards, configuration profiles, and relevant system state. |
| Power | Battery, charger, power settings, and power-condition findings. |
| Reports | Complete scan across all supported system_profiler data types, including legacy or hardware-dependent sections. |
The exact sections and fields returned vary by macOS version, Mac model, attached hardware, permissions, and installed software. An empty section means only that the command returned no records for that section during that collection.
How it works
Link to section: How it worksLive scan on this Mac Existing JSON report
/usr/sbin/system_profiler system_profiler -json
│ │
└──────────────────┬─────────────────────┘
▼
Validated recursive JSON parser
│
▼
Stable subject and data-type organization
│
┌──────────────┴──────────────┐
▼ ▼
Collapsible findings Offline explanations
and source fields and privacy guidance
│ │
└──────────────┬──────────────┘
▼
Search, bookmark, snapshot, export, and compareThe parser preserves structured values instead of flattening away their source context. Exact field explanations are used where the schema is known; careful data-type context is used for changing or hardware-specific schemas. Unknown fields remain visible and are labeled as unrecognized rather than assigned an invented meaning.
Download v0.1.2
Link to section: Download v0.1.2Download the universal macOS build from Releases v0.1.2:
The bundle supports macOS 13 or later on Apple silicon and Intel Macs. Version 0.1.2 adds the Open Layers identity, welcome artwork, and a dedicated About window. It is ad hoc signed and is not Apple-notarized, so Gatekeeper may require a one-time approval after download.
Install and run
Link to section: Install and run-
Download both the ZIP and checksum file from the v0.1.2 release.
-
In Terminal, change to the download directory and verify the archive:
shasum -a 256 -c SystemProfilerExplorer-0.1.2-macOS-universal.zip.sha256Continue only if the result ends with
OK. -
Double-click the ZIP, then move
SystemProfilerExplorer.appto the Applications folder. -
Open the app. Select a subject and choose its scan button, or choose Scan Reports for complete coverage.
No administrator password is required to run the app. Some profiler sections can still be unavailable because of macOS permissions or hardware support; the app reports collection failures instead of hiding them.
Open the app safely when Gatekeeper intervenes
Link to section: Open the app safely when Gatekeeper intervenesBecause v0.1.2 is not notarized, macOS may say that Apple cannot check it for malicious software or that the developer cannot be verified. First verify the SHA-256 checksum above. Then use one of Apple’s one-app approval paths:
- In Finder, Control-click
SystemProfilerExplorer.app, choose Open, then confirm Open; or - Try to open the app once, open System Settings → Privacy & Security, and choose Open Anyway for System Profiler Explorer.
The approval is specific to this app. Do not globally disable Gatekeeper, and do not enter commands that remove protections system-wide. Apple documents the same review-and-open workflow in Safely open apps on your Mac.
Use the app
Link to section: Use the appScan this Mac
Link to section: Scan this MacChoose a subject in the sidebar and start its focused scan, or choose Scan Reports to run a complete scan. system_profiler can take several minutes for large software inventories; progress remains visible while it runs.
Import raw system_profiler JSON
Link to section: Import raw system_profiler JSONCreate a complete report outside the app when needed:
/usr/sbin/system_profiler -json -detailLevel full > full_report.jsonOpen System Profiler Explorer, choose Import JSON…, and select the file. The import is validated and read locally without modifying the source file or retaining its path in the displayed report.
Read the results
Link to section: Read the resultsEach report opens with At a glance: a few plain sentences built from the collected values, followed by any values worth a look, each with a Show button. Each finding shows its value, a status, and a one-line meaning; expand it for details, the reasons behind a “Likely” reading, a suggested next step when there is one, and the field’s general explanation. Terms such as SIP, SMART, or dBm link to short definitions, and the Glossary lists them all.
Use the Beginner / Developer switch in the header to choose how much technical detail to show. Right-click a finding to copy its value, its source path, or the whole finding as Markdown.
Search and filter
Link to section: Search and filterSearch matches displayed values, source fields, record names, and explanation text, including the plain-language meaning of values. Use Worth a Look to see only values that may need attention, Explained to focus on interpreted fields, or Privacy to review values that deserve care before sharing. The recent-search menu keeps recent searched terms. Records that contain values worth a look are marked, and Developer mode adds finding counts to sections and the sidebar.
Bookmark and trace a finding
Link to section: Bookmark and trace a findingUse the bookmark button beside a finding to add its full explanation to a shared summary. Bookmarks remember the exact value, even when several records share the same field. Open Bookmark takes you straight back to it, while Show Raw Source Location filters to and highlights the underlying system_profiler field. Array-shaped paths use [] to identify the raw field schema; record context remains visible in the surrounding disclosure.
Every finding also labels the scope of its explanation:
- Curated explanation is a maintained field-specific entry in the app’s catalog.
- General data-type context is careful context for an evolving or hardware-specific section, rather than a claim that Apple’s exact field schema is known.
- Unrecognized field preserves the reported value without an invented interpretation.
Understand diagnostic logs
Link to section: Understand diagnostic logsExpand Diagnostic Log Contents to review recognized AVE/HEVC encoder patterns. The summary separates observed log counts and process labels from possible image-processing explanations and facts the excerpt cannot establish. Process labels are not signature verification; encoding does not by itself establish recording or transmission. Explanation badges describe coverage, not a safety verdict.
Analysis is limited to the first two million characters and explicitly labels partial results. View original log text preserves the entire field in 12,000-character pages. Unsupported patterns remain available without an invented diagnosis. Logs can include private paths and attachment names; review them before sharing.
Save a local snapshot
Link to section: Save a local snapshotChoose Snapshots in any collected report to save a named baseline. A Full values snapshot stays local and can be compared with later scans in What Changed?. A Redacted values snapshot replaces scalar values before storage and is intentionally not comparable. Choose a retention policy of 5, 10, 25, or all snapshots; the app removes the oldest local snapshots beyond that limit.
Snapshots are stored under this Mac’s Application Support directory, never in the repository or a cloud account. Treat full snapshots as sensitive system inventory.
Share and compare
Link to section: Share and compareChoose Share › Report File to save the scan data. The export review offers two explicit choices:
- Redacted report replaces every reported scalar and record name, omits exact collection times, and removes standard-error text.
- Full private report preserves exact values and metadata for private analysis and future comparison.
A current scan can be compared with a compatible full report created from the same subject or full-report scope. Named records are matched independently of order; unnamed records and array elements are matched by position. Added, removed, and changed values identify structured differences, not their cause or security impact.
Compare in What Changed?, under Tools in the sidebar. Pick a saved snapshot of the same report (or compare with the latest in one click), or choose a file: a full export from this app or raw system_profiler -json output. It then presents clear added, removed, and changed totals. Differences are grouped as Review First, Worth Reviewing, or Informational to guide triage—not to assign a threat level. Expand a difference for its baseline/current values, raw source location, and a plain-language explanation grounded in the app’s explanation catalog.
For a readable document, choose Share › Summary. The app exports Markdown or PDF with At a glance, the values worth a look, the full explanations of any bookmarked findings, collection limits (including skipped sections), and an explicit privacy warning. It never folds raw JSON into this summary; use Share › Report File when raw evidence is required.
Build from source
Link to section: Build from sourceRequirements:
- macOS 14 or later for development
- Xcode 26 or a compatible Swift 6 toolchain
- XcodeGen only after changing
project.yml
Clone and open the checked-in Xcode project:
git clone https://github.com/hideouts-io/SystemProfilerExplorer.git
cd SystemProfilerExplorer
open SystemProfilerExplorer.xcodeproj
Run the publication safeguard and test suite from Terminal:
./scripts/check-publication-boundary.sh

xcodebuild -project SystemProfilerExplorer.xcodeproj \
  -scheme SystemProfilerExplorer \
  -destination 'platform=macOS' \
  build test
Build the same universal ZIP and checksum layout used by the v0.1.2 release:
./scripts/build-release.shGenerated assets are written under the ignored dist/ directory. The script verifies the app metadata, strict code-signature integrity, arm64 and x86_64 slices, minimum macOS version, and SHA-256 manifest. It produces an ad hoc signed development distribution; Developer ID signing and Apple notarization require the maintainer’s Apple Developer credentials and are not simulated by the script.
In Codex, the local Run action uses script/build_and_run.sh to build, ad hoc sign, and open a Debug app without requiring an Apple Developer certificate.
Privacy and interpretation boundaries
Link to section: Privacy and interpretation boundariessystem_profiler can reveal serial numbers, hardware UUIDs, device identifiers, user names, local paths, network addresses, installed applications, timestamps, and other host fingerprints. Treat a full report as private system inventory.
- Collection and analysis remain local unless you explicitly export or share a file.
- Raw reports, snapshots, Xcode user state, and generated report files are ignored by Git.
- A publication-boundary script rejects known report formats, user-specific absolute paths, and private-key material before release builds.
- Screenshots and bug reports must use synthetic or thoroughly sanitized data.
- A profiler value proves only what the local command reported at that moment. It does not prove account ownership, remote activity, malicious intent, or compromise.
Do not attach raw output to a public issue. If a private report is essential to a security report, first arrange an approved private transfer method with the maintainer.
Project structure
Link to section: Project structureSystemProfilerExplorer/
├── SystemProfilerExplorer/ SwiftUI app, collection, parsing, and explanations
├── SystemProfilerExplorerTests/ Behavior, integration, import, export, and coverage tests
├── docs/images/ Sanitized README screenshots
├── script/ Local Codex build-and-run action
├── scripts/ Publication and universal-release checks
├── SystemProfilerExplorer.xcodeproj Checked-in Xcode project
├── LICENSE MIT open-source license
└── project.yml XcodeGen project sourceContributing and security
Link to section: Contributing and securityBefore proposing a change, read CONTRIBUTING.md for development, interpretation, testing, and fixture rules. Report security problems using the private process in SECURITY.md, never with an unredacted profiler report in a public issue.
License
Link to section: LicenseSystem Profiler Explorer is open-source software released under the MIT License. You may use, copy, modify, distribute, sublicense, and sell the software, including for commercial purposes, as long as copies or substantial portions retain the copyright and license notice. The software is provided without warranty.